

Creating an infographic is a powerful way to convey complex information in a visually appealing manner. Whether you’re a marketer, educator, or enthusiast, knowing how to make an infographic can elevate your communication game.
In this guide, we’ll walk you through the process of crafting compelling infographics that engage your audience and effectively deliver your message.
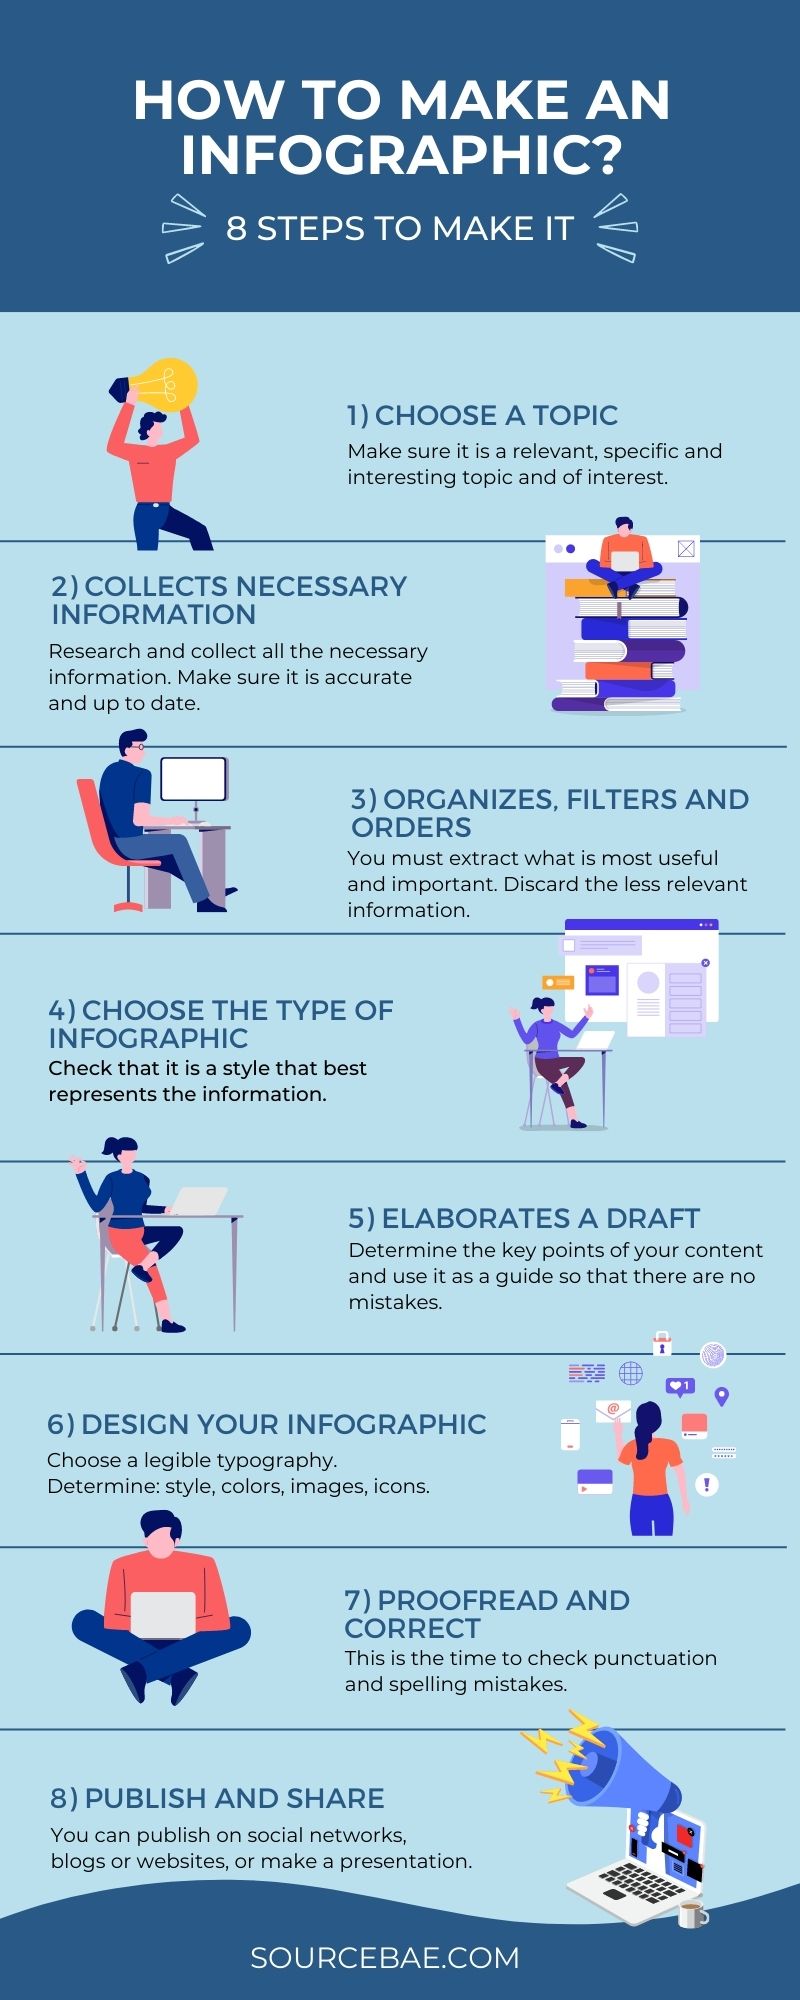
How to Make an Infographic
Crafting an effective infographic involves several key steps that ensure your message is clear, engaging, and visually striking. Let’s dive into the detailed process:
1. Define Your Purpose and Audience
Before you begin, clearly define the purpose of your infographic and identify your target audience. Understand the main message you want to convey and tailor your design to resonate with your viewers.
2. Gather Relevant Data and Content
Collect accurate and reliable data that supports your message. Ensure that your content is concise, relevant, and well-organized. Remember, an infographic should tell a story through data.
3. Choose the Right Infographic Type
Select the infographic type that best suits your content. Common types include informational, comparison, process, timeline, and geographic infographics. The type you choose should align with your data and message.
4. Plan the Layout and Design
Sketch a rough layout of your infographic, considering the placement of text, images, and other elements. Use a grid structure to maintain visual consistency. Choose a color scheme that matches your branding and creates visual harmony.
5. Craft a Compelling Headline
Create an attention-grabbing headline that summarizes the main message of your infographic. Use clear and concise language to pique your audience’s interest.
6. Visualize Your Data
Convert your data into visually appealing charts, graphs, icons, and illustrations. Choose visuals that enhance understanding and make complex information more digestible.
7. Arrange Content Sequentially
Organize your content in a logical sequence, guiding your audience from start to finish. Ensure that your infographic flows smoothly and maintains a cohesive narrative.
8. Add Supporting Text
Incorporate brief, impactful text to complement your visuals. Use concise explanations, bullet points, and captions to provide context and enhance the viewer’s understanding.
9. Embrace White Space
Don’t overcrowd your infographic with excessive information. Leave ample white space to prevent visual clutter and help your audience focus on the key points.
10. Review and Edit
Thoroughly review your infographic for accuracy, clarity, and coherence. Check for any spelling or grammar errors. Edit your content to make every word count.
11. Optimize for Sharing
Save your infographic in a format suitable for both print and digital use. Consider creating different sizes for various platforms. Ensure that your infographic is shareable and downloadable.
12. Promote Your Infographic
Share your infographic across your social media platforms, website, and relevant online communities. Engage with your audience’s feedback and encourage them to share your creation.
13. Measure Impact
Track the performance of your infographic using analytics tools. Monitor engagement, shares, and conversions to gauge its effectiveness and make improvements for future projects.
FAQs about Making Infographics
Q: What tools can I use to create an infographic?
A: There are several user-friendly tools available, such as Canva, Piktochart, and Venngage, that offer pre-designed templates and easy-to-use features.
Q: Can I use images and icons from the internet in my infographic?
A: Yes, but ensure that you have the right to use those images. Look for images under Creative Commons licenses or purchase from stock photo websites.
Q: How do I maintain a balanced visual appeal in my infographic?
A: Focus on using a consistent color palette, font style, and iconography throughout your design. This helps maintain a cohesive and visually pleasing infographic.
Q: What’s the ideal length for an infographic?
A: While there’s no fixed length, aim for a concise presentation. Most infographics are between 800 to 1500 pixels wide and can be as long as necessary to convey your message effectively.
Q: Can I embed interactive elements in my infographic?
A: Yes, some tools allow you to add interactive features like clickable links, pop-up information, and animations to enhance user engagement.
Q: How do I choose the right color scheme for my infographic?
A: Select colors that align with your brand’s identity and evoke the desired emotional response. Use tools like Adobe Color to create harmonious color palettes.
Conclusion
Now that you have a comprehensive understanding of how to make an infographic, you’re ready to create visually stunning and informative designs. Remember, the key to a successful infographic lies in a clear message, engaging visuals, and a seamless design. By following these steps and embracing your creativity, you’ll craft infographics that captivate your audience and effectively convey your message.